The Math Intercept 5
Clay cheese plate adventure, cleanest and safest energy sources, math careers and more


Hey everyone!
Since the last time, I attended a pottery class. The instructor told us to make a cheese plate. We were given freedom for our designs. I chose something mathematical, of course—a nautilus-shaped cheese plate! Let’s see how it will turn out once it is baked.
It is a tradition among math teachers to come up with interesting math activities or games when the new year comes. Sarah Carter from Math Equals Love shares a nice puzzle for example.

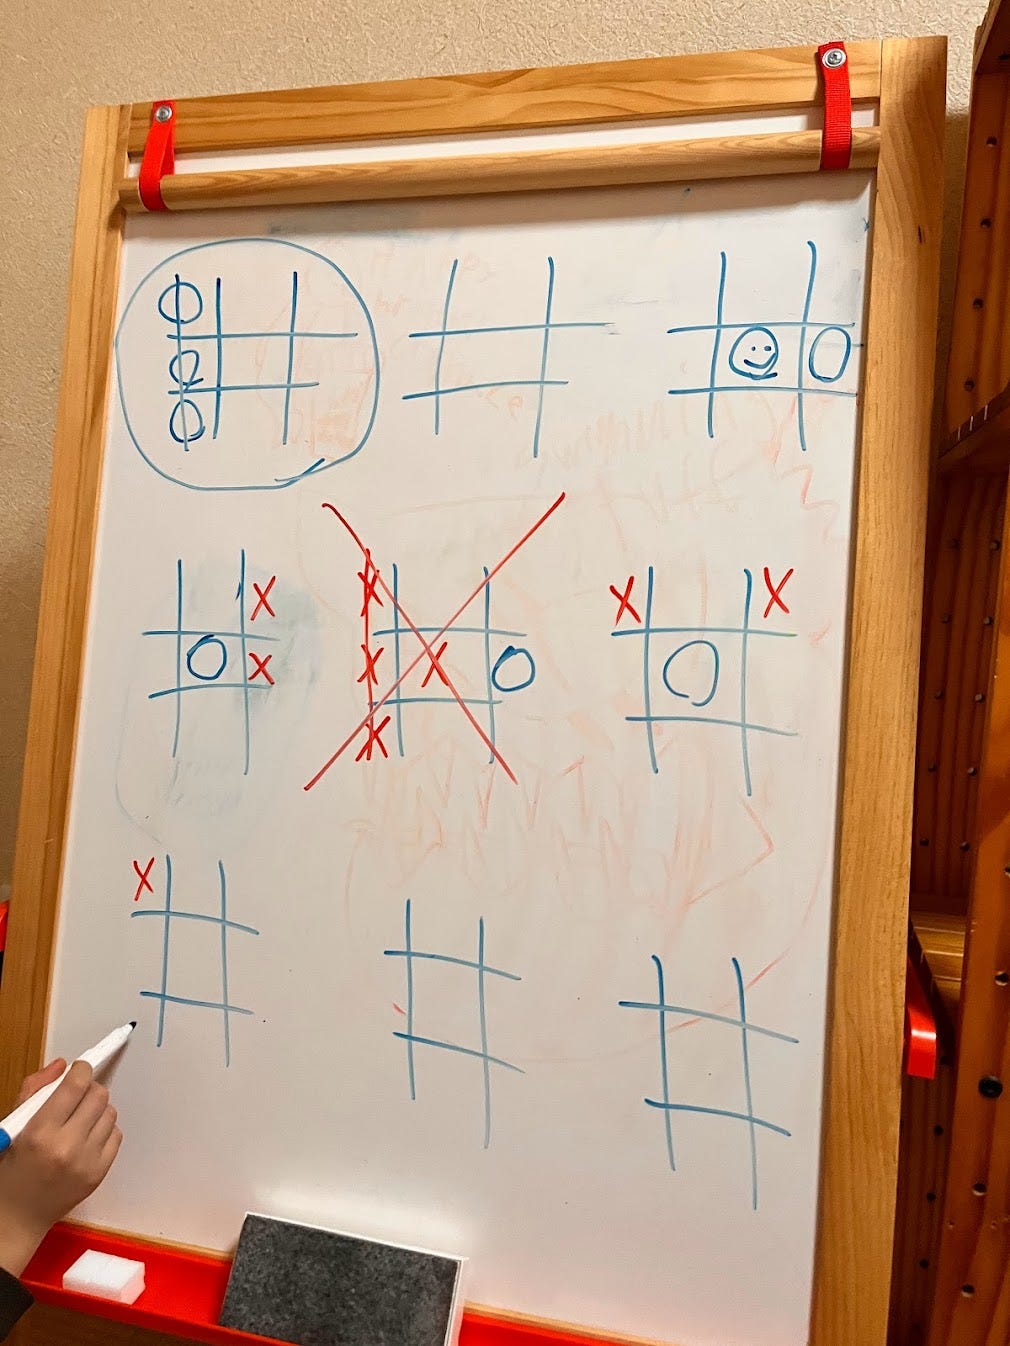
I played ultimate tic-tac-toe with my sons. It is not a new year-themed game but it has been a fun contribution to this winter holiday for us.
I came across another mathematics encounter on Netflix this week. A new Japanese series named Fermat’s Cuisine tells the story of a math olympiad student who loses his hopes of becoming a mathematician like Pierre de Fermat. But then he meets with a mysterious chef and his life changes. The TV drama is an adaptation of a manga. Our math genius who is also talented in cooking eats the chef’s Napolitano and suddenly starts “seeing”. He finds himself in a world of numbers and equations. The taste opens his vision. An interesting show for the Winter Break.
Behold the last Math Intercept of the year. We have nunatak (😮), an amazing polyomino puzzle, and many more! Enjoy.
Math Eyes: Nunatak

A nunatak is a mountain peak or ridge that protrudes above a surrounding glacier or ice sheet. The word comes from the Inuit language, meaning "lonely mountain." Nunataks are formed when glaciers erode the surrounding landscape, but cannot reach the highest peaks due to their steepness or the fact that they are made of resistant rock. As a result, the nunataks stand out like islands in a sea of ice.
This photo I share above belongs to artist Renan Öztürk, who captured the Pyramid, in the Ellsworth Mountains in Antarctica. The British Antarctic Expedition of 1910-1913 discovered the first Pyramid. Öztürk’s 2021 photo captures the pyramid at an amazing angle. It nearly looks like a human-made structure in the middle of the desert.
‘‘A polar pyramid. More than anything else we saw on the expedition this sculpture of earth and wind captured our imagination. Easily could have spent the entirety of the time just capturing the 24hr sunlight tracking around this icy sun-dial with the pastel color of the ice/sky horizon casting moodscapes behind it.’’ Renan Öztürk
Curious Puzzles:
Our first puzzle is from Tanya Khovanova’s blog.

You are given a 5-by-7 rectangle with two corners cut out: A 1-by-1 tile is cut from the bottom left corner, and a 1-by-2 tile is cut out of the top right corner, as in the picture. The task is to cut the resulting shape into two congruent polyominoes.

Answers for the Puzzles from the previous issue
12

A time such as 3:59:53 is palindromic, that is, it reads the same forward and backward. in a day starting from 0:00:00 to 23:59:59, there are 660 occasions when the time is palindromic. Among them which of the two is closest?
Answer: 09:59:59 and 10:00:01
Proofs Without Words

Math in Action
One of the greatest hurdles in teaching middle and high school math is accommodating the diverse learning gaps within a single class. Imagine a tenth-grade student tackling problems with quadratic equations. If they haven't fully grasped algebraic factorization in the earlier years, then the problem-solving becomes an impossible task. With standardized testing looming and new concepts piling on, such gaps can quickly snowball, leading to frustration and disengagement. Fact fluency is something essential for students to move their learning to further steps. Without factual knowledge the inquiry activities become ineffective.
Stephen Sawcuk from Education Week shares the results of a survey that was answered by 300 educators. The results showed that mastering math facts is crucial for students' success in higher grades. While the approach varies, teachers all agree on its importance. Early grades focus on understanding and strategies, then gradually transition to fluency practice through games and online tools. By 4th grade, fluency becomes essential for complex work like fractions. Middle school assumes mastery and offers support like calculators for struggling students, prioritizing covering grade-level material while occasionally reviewing crucial basics. Ultimately, the goal is for students to retrieve facts automatically and efficiently, freeing their minds for higher-order problem-solving. but in the end, factual knowledge and memorization are essential for learning higher-level mathematics.
(P.S There is a nice discussion on memorization and knowing the facts in
by )🟧 🟧 🟧
When we start moving or doing any physical activity, neurons in our bodies communicate with each other. These happen through electrical impulses that follow certain patterns. Research published in Physical Review E on neuroscience made a breakthrough in the area after using an algebraic approach to understanding the spike-times of neural codes in the hippocampus. Mathematical representation gives a significant insight into how memories are formed.

You can read the details of this research here.
🟧 🟧 🟧
“Where will I need this in the future?” is a question that frustrates math teachers. It is often challenging for students to connect what they learn in class with real-life situations. a variety of careers need mathematical skills, but it is not easy for students to immediately associate them with what they learn in class.
Sarah D. Sparks from Education Week, interviews experts who use geometry and statistics in their jobs and they explain how they need mathematics in their careers. Retired PIXAR computer animator Tony DeRose, shares that making fancy animations needs an artistic eye, but building the tools to make them requires mathematical skills. For instance, knowing how shapes fit together and move in space, in other words use of geometric transformations is needed. Public health researcher Kristin Baltrusaitis discusses how she uses statistics in clinical trials of anti-AIDS drugs. Data analysis of different doses and concentrations over time helps her understand if the developed medicines are efficient or not. A journalist Geoff Hing shares how he uses descriptive statistics in journalism.
🟧 🟧 🟧
In Jingzhou, China, archaeologists found ancient bamboo slips from the Warring States period (475-221 BCE) at the Qinjiazui site. Some of these bamboo slips have the earliest multiplication tables dating back 2300 years from now.
The inscribed hieroglyphic text on the bamboo slip includes examples such as “Five times seven is thirty plus five; four times seven is twenty plus eight; three times seven is twenty plus one.” This ancient mathematical artifact was unearthed using infrared technology.
Researchers believe that these ancient artifacts, particularly the multiplication table, were utilized by Chinese government officials of the Warring States period for industrial calculations and similar purposes.
Dario Radley, Archeology News Online Magazine
🟧 🟧 🟧
Quanta Magazine published a video on their YouTube channel and shared the three biggest mathematical breakthroughs of 2023. These breakthrough achievements are
the proof of a new, tighter upper bound to Ramsey numbers (graph theory)
discovery of aperiodic monotiles
three arithmetic progression (combinatorics)
What is going on in this graph?
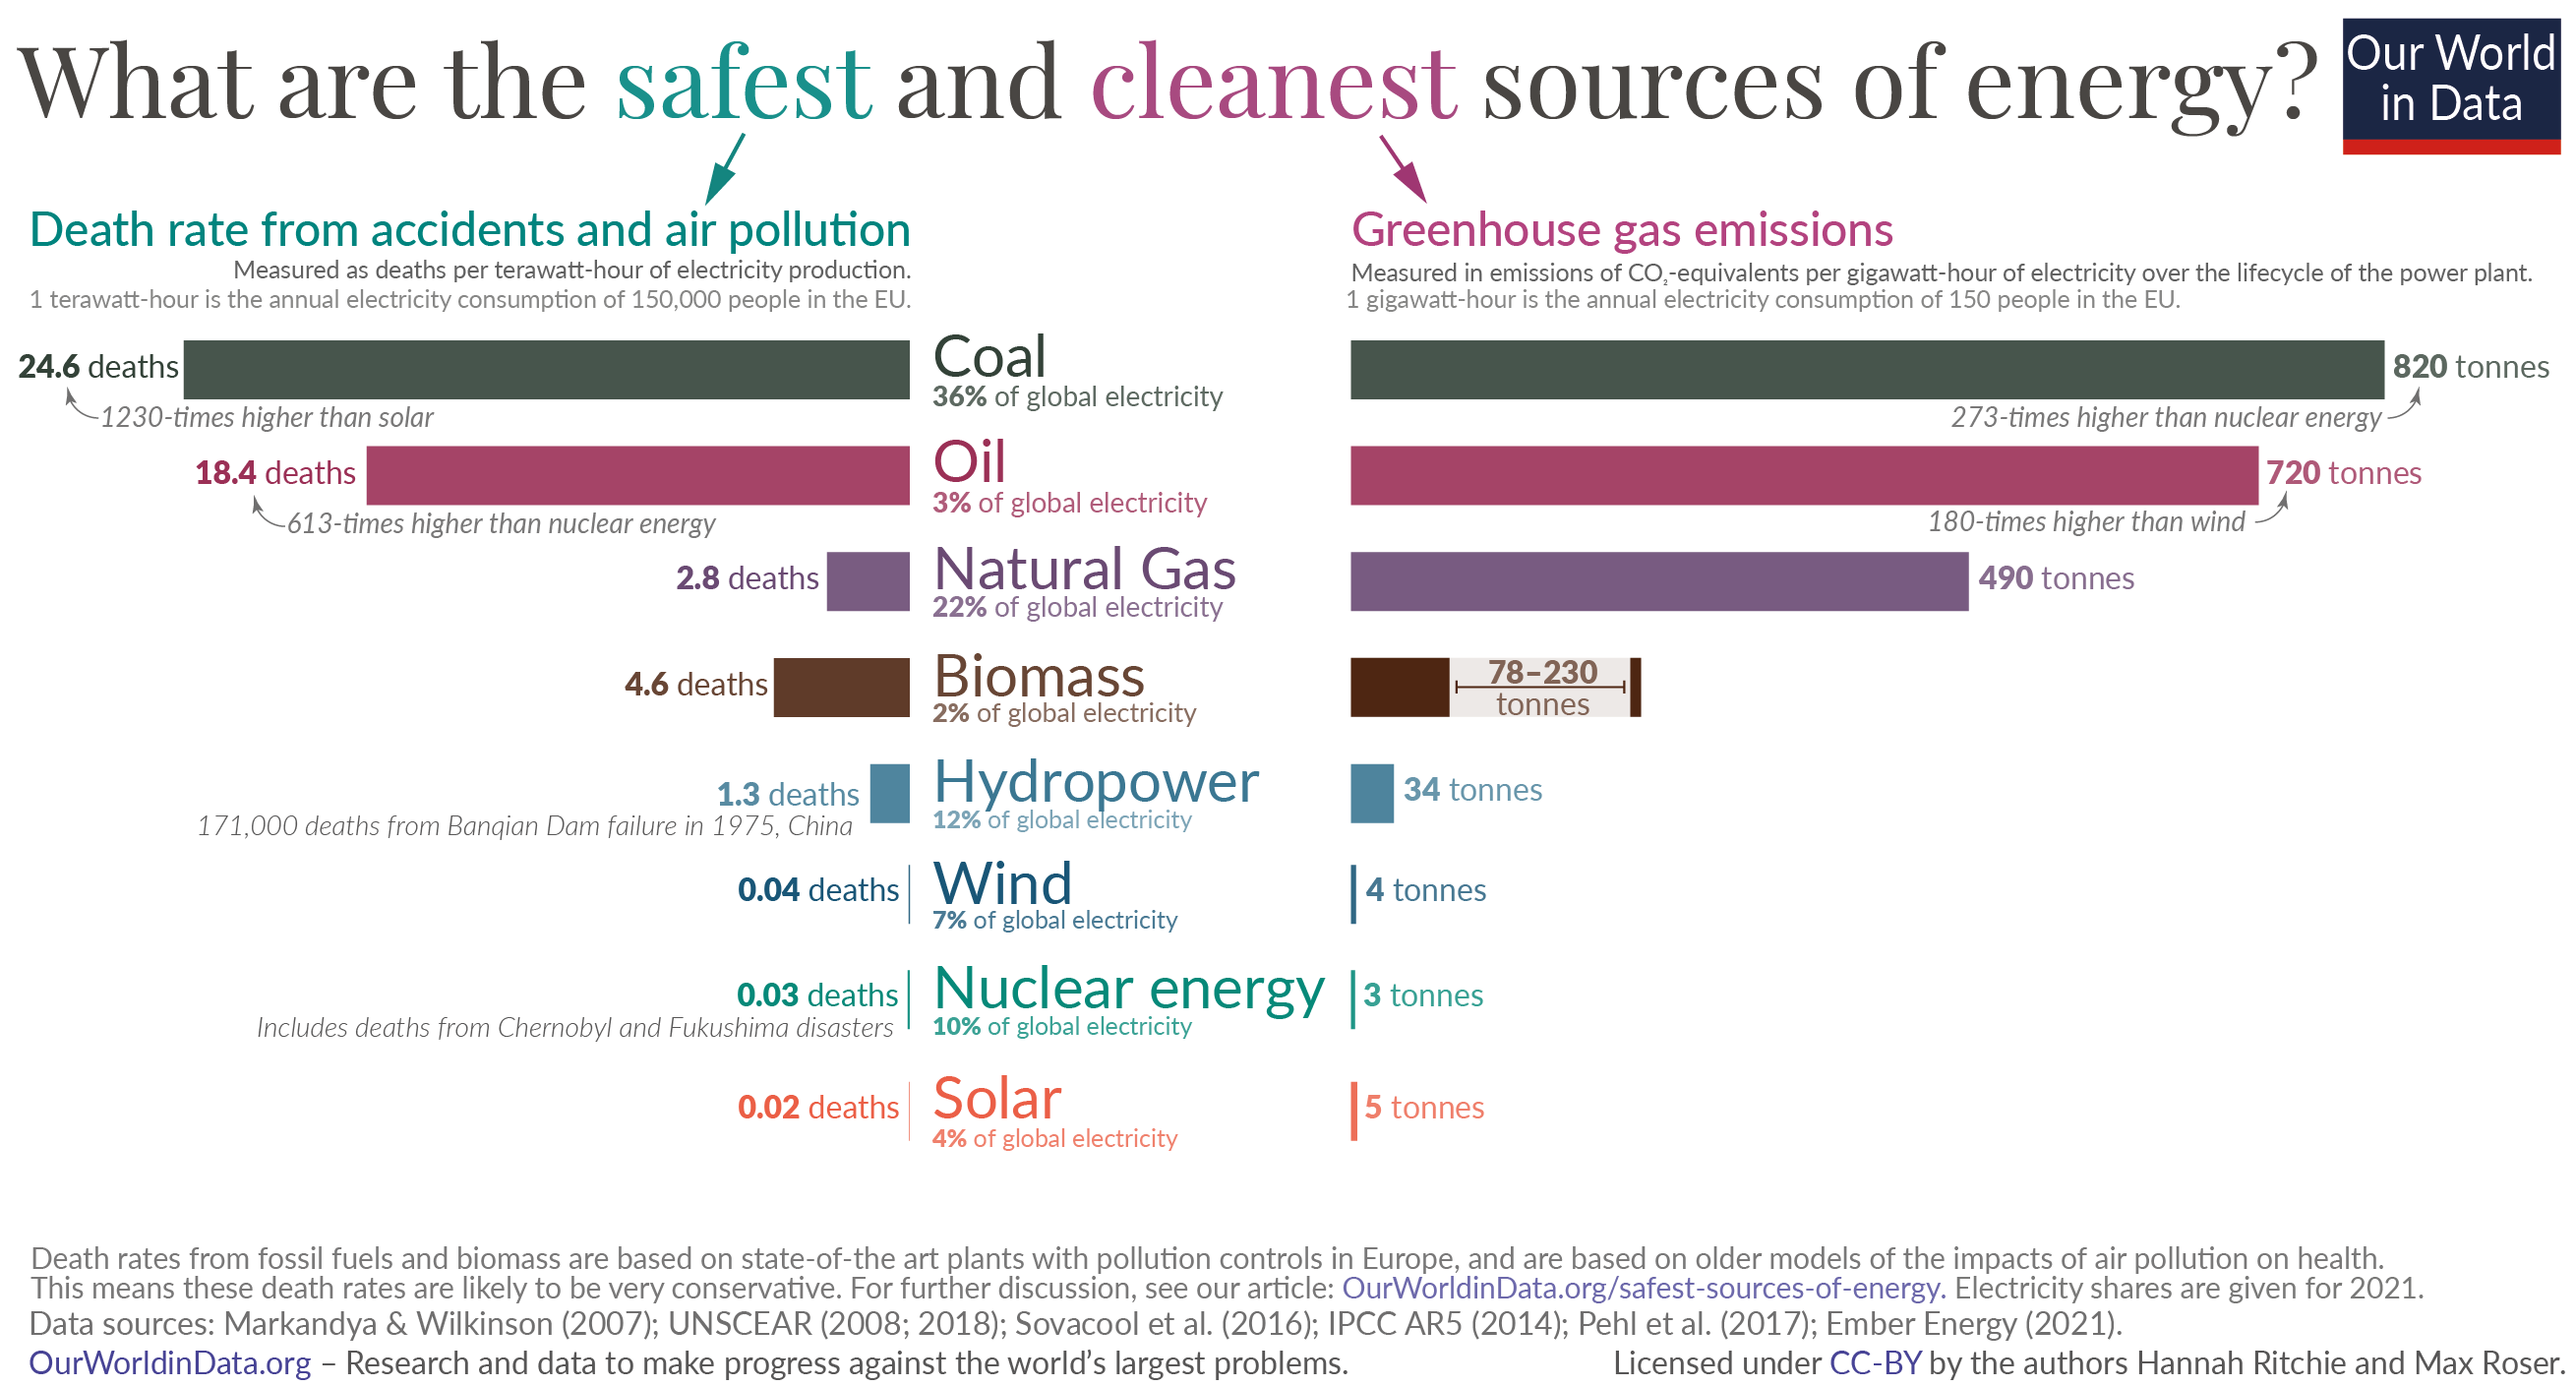
This chart dramatically shows how dangerous the fossil fuels are. nuclear energy and solar power options are far safer and cheaper in electricity production.
Our World in Data provides an amazing comparison of how deadly the use of coal and oil in energy production:
Let’s consider how many deaths each source would cause for an average town of 150,000 people in the European Union, which – as I’ve said before – consumes one terawatt-hour of electricity per year. Let’s call this town ‘Euroville’.
If Euroville were completely powered by coal, we’d expect at least 25 people to die prematurely every year from it. Most of these people would die from air pollution.
This is how a coal-powered Euroville would compare with towns powered entirely by each energy source:
Coal: 25 people would die prematurely every year;
Oil: 18 people would die prematurely every year;
Gas: 3 people would die prematurely every year;
Hydropower: In an average year, 1 person would die;
Wind: In an average year, nobody would die. A death rate of 0.04 deaths per terawatt-hour means every 25 years, a single person would die;
Nuclear: In an average year, nobody would die – only every 33 years would someone die.
Solar: In an average year, nobody would die – only every 50 years would someone die.
Source: Hannah Ritchie (2020) - “What are the safest and cleanest sources of energy?” Published online at OurWorldInData.org. Retrieved from: 'https://ourworldindata.org/safest-sources-of-energy' [Online Resource]
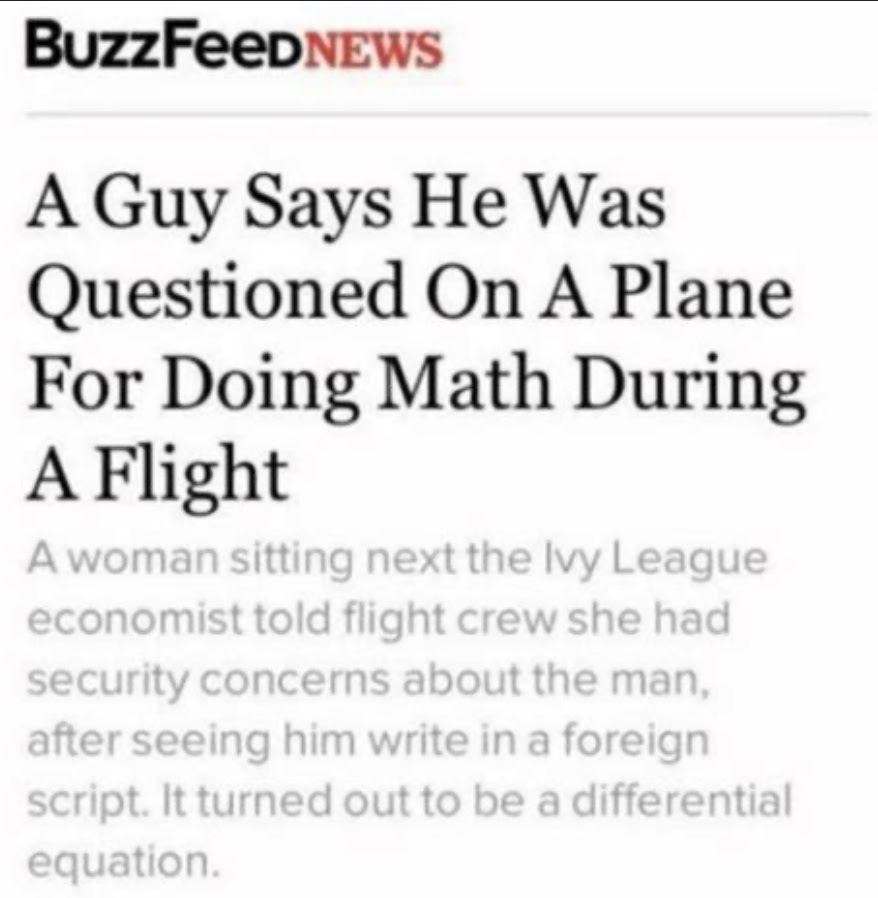
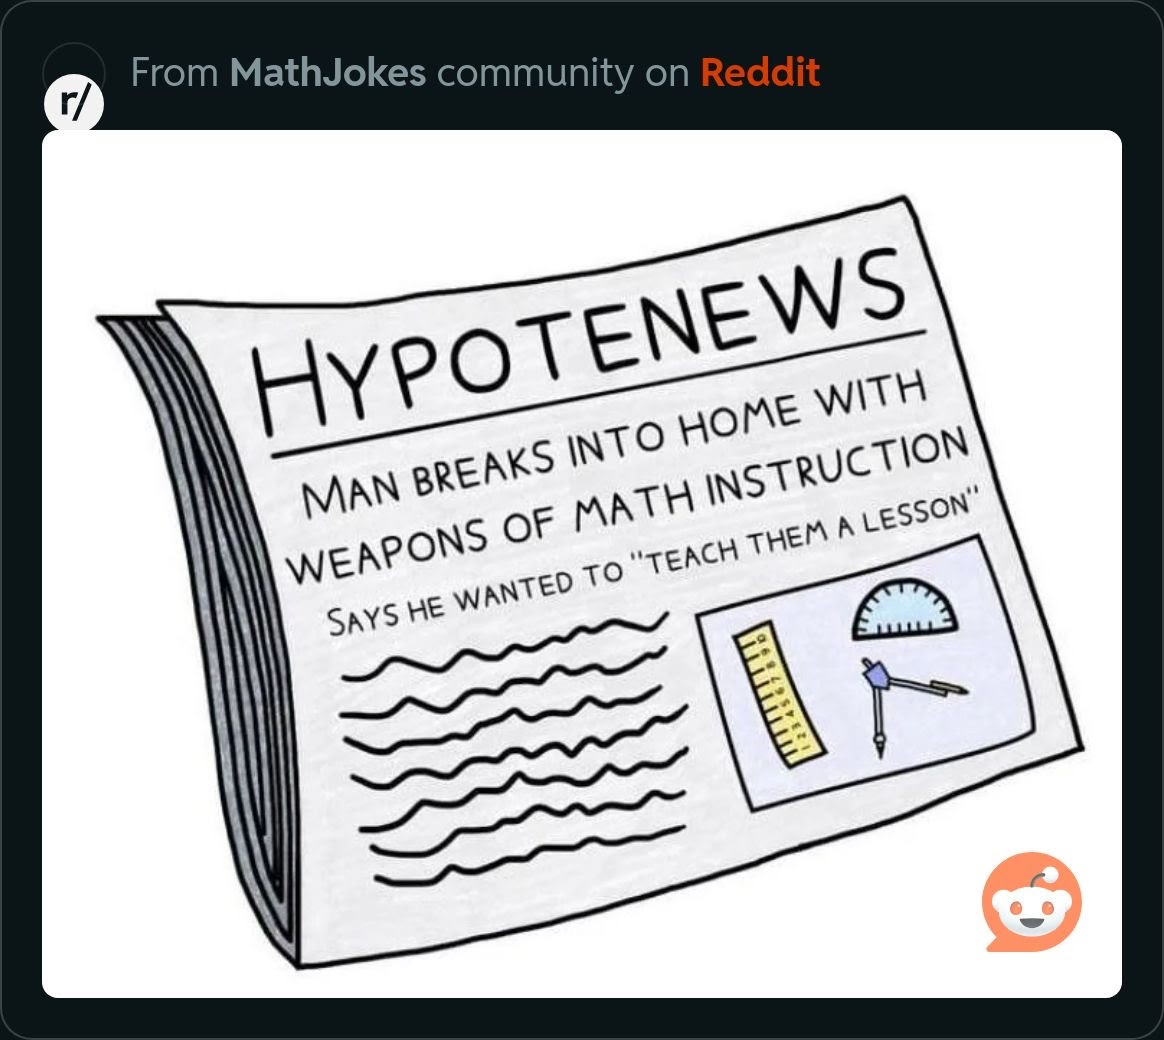
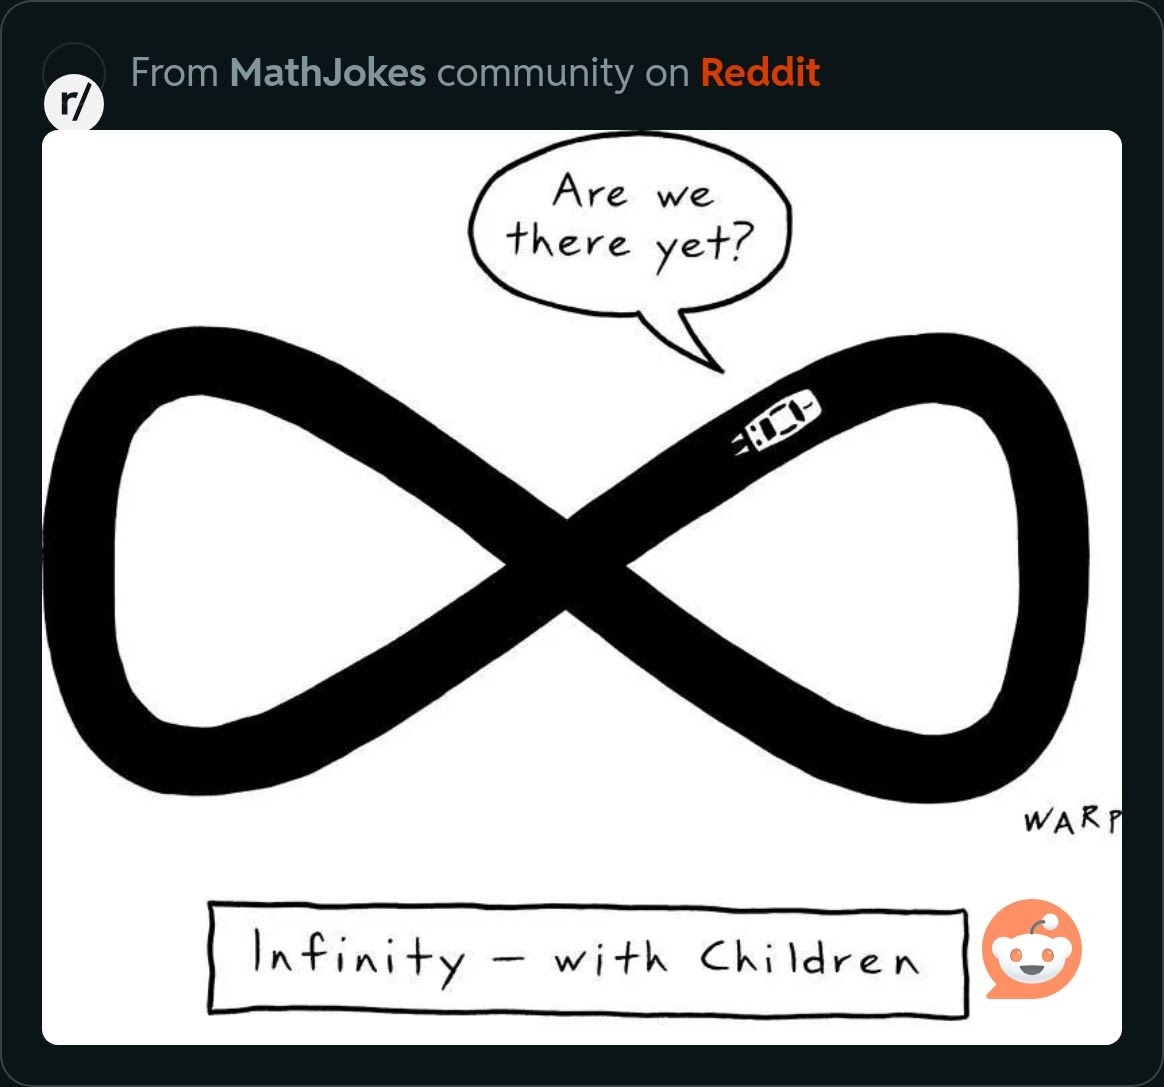
Mathemania: Funny Math from the Internet


I hope you enjoyed the Math Intercept.
Happy New Year!